Analyzing Data Usage
The Data Usage dashboard displays information about the type and amount of data used by selected devices.
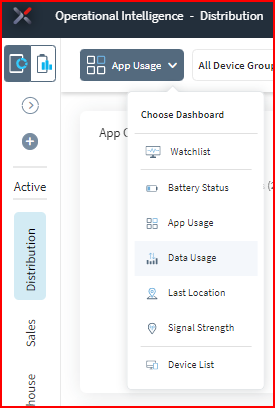
To open the Data Usage dashboard, click the SOTI XSight main menu
![]() , select Operational Intelligence, then select Data Usage
from the dashboard dropdown.
, select Operational Intelligence, then select Data Usage
from the dashboard dropdown.
Use the charts on the Data Usage dashboard to view information such as data usage of top
apps, data usage of top browsers, and total data usage for a selected period of time.
The bottom of the dashboard lists all devices in the selected analysis profile. Clicking
on a segment or column in a chart refines the list, and clicking on any of the devices
in the list opens the Device Spotlight view, where operational details of the selected
device are displayed. 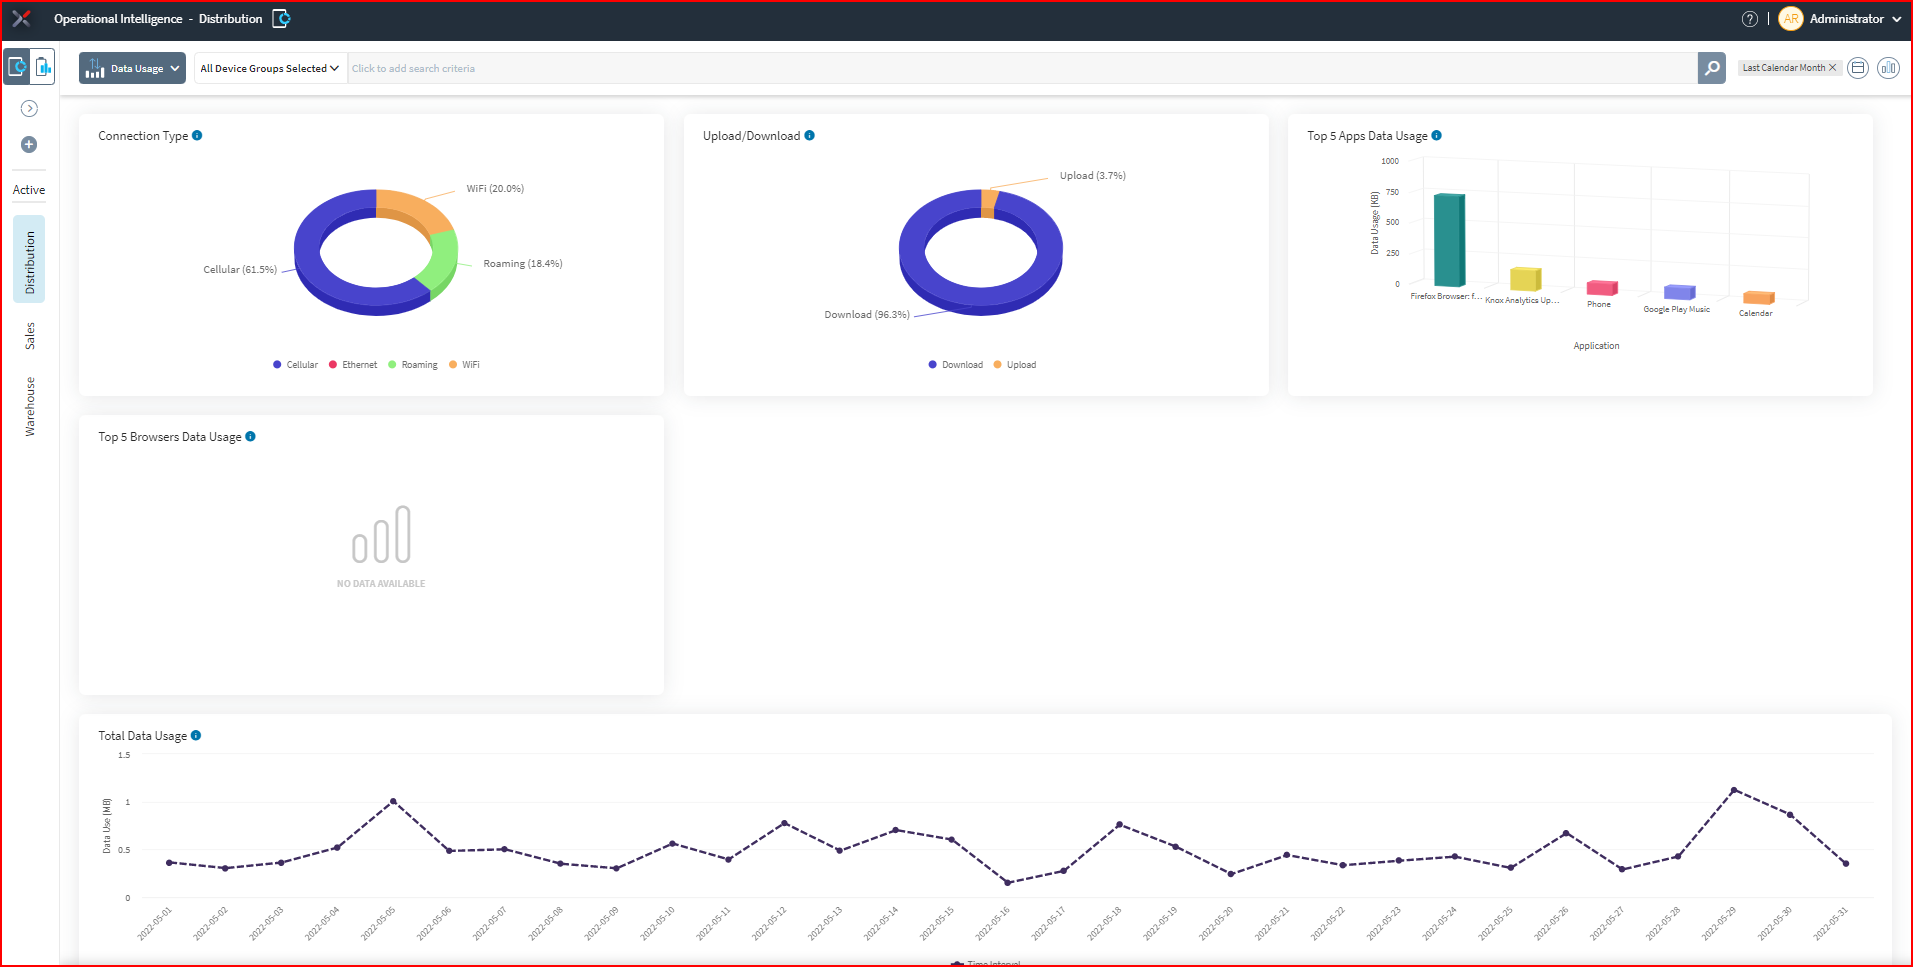
The following data usage charts can be added or removed from the dashboard by clicking on
the  icon.
icon.
| Dashboard | Description |
|---|---|
| Top manufacturers | lists data usage by device manufacturer |
| Top models | lists data usage by model type |
| Top OS versions | lists data usage by operating versions |
| Connection type | lists data consumed by Wifi/cellular/roaming |
| Upload/download | shows data usage categorized by the type of transaction |
| Data usage of top Apps | lists which Apps used the most data |
| Data usage of top browsers | lists data usage of categorized by browser |
| Total data usage | lists total data usage across all devices being analyzed during a selected period of time |