This topic describes how you can monitor your devices in Live View.
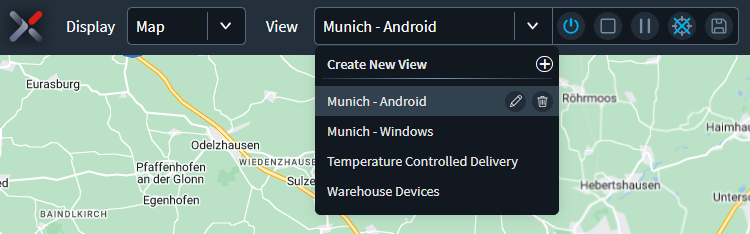
In Live View, monitoring devices happens using "views" that you create. A view can
represent anything that you want to watch, such as the status of a particular group of
devices in a defined region. You can add as many devices as you like to a view and
select the information you want to track. You can play, pause and rewind a view as far
back as two hours so you can see everything that happened during that time. Save
frequently used views for future reference and open them again at any time.
After creating views and adding devices, you can gather device intelligence using the map
or the list display. The map is especially suitable for monitoring devices that are
outside and can supply GPS data. You might use List display for devices that cannot
supply location data either because they do not have GPS radios, or because they are
indoors. For example, if all your devices never leave a warehouse, you could use List
view all the time.
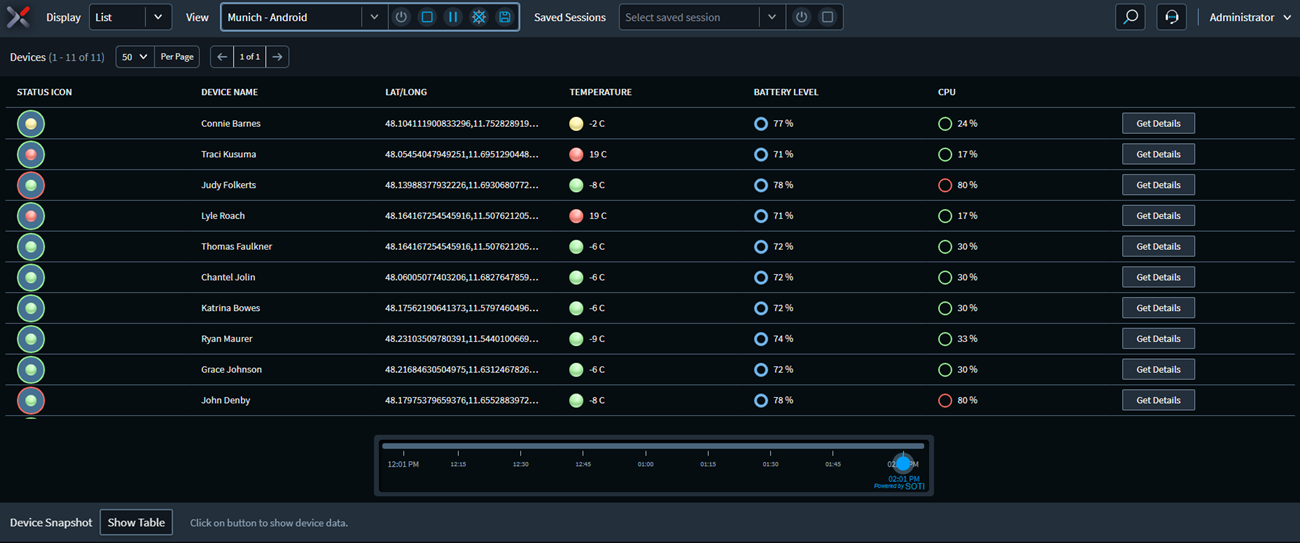
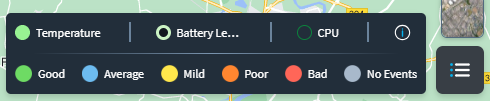
On the map display, a colored icon marks the location of each device. The three colored
rings of the icon each represent a specific type of information as assigned by you.
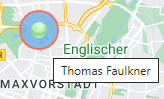
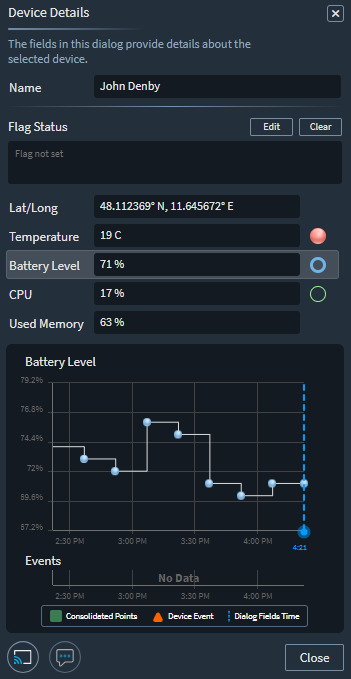
Selecting an icon opens the device details panel where you can see in-depth details about
the device. From here, you can also interact with the device and device user with
SOTI XSight's Remote Control and Live Support features.
The Map can also display other icons, such as tag pins originating from external tag
servers. For example, a tractor or a crane. The flag icon is
for assigning a special note or condition to a device. For example, notifying the user
of an important issue. You can view a flag message by clicking on the device icon.
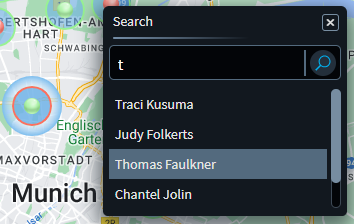
Use the Search feature to find individual devices on the view. Selecting a device in the
search list highlights it on the map.
Use the legend at the bottom-right of the Map to see what the ring colors mean and to
access overall statistics.
Live View can automatically generate notifications of events that may affect the
operation of a device, such as excessive battery level drop over a short period of
time.
With Live View, data travels directly from the SOTI XSight Agent
Service to the browser. It does not interact with the database for live sessions, but
saving a session will save data to the database.